The Basics 1
To create maps and reports, you need to understand the key concepts of Scan/US. On this help page, you'll learn the key terms you need. You'll become familiar with the toolpad modes and submodes that you'll be using all the time.
You'll also learn two "operational rules" that will make it a lot easier to use Scan/US. Since they are important, let's identify them now.
Scan/US Rule 1: Be able to identify the active map layer.
Scan/US Rule 2: Be able to identify -- and be aware of -- the active toolpad mode.
We'll also explore the geographic layers and databases you'll work with. By reading the illustrated help files -- indexed in a link at the top of this page -- you can explore Scan/US capabilities in depth, and step-by-step.
Section Topics
- Study areas: creating and navigating
- Toolpad mode and current map layer: two key concepts.
- Toolpad Modes and Submodes
- Layers in the map
- Databases
- Help files
- Printing a demographic site report with Site Express
Study areas
A study area is the market area you want to analyze. A study area can be as large as the continental U.S. or as small as a block group or microgrid. The default study area is a map of the continental United States. This can be changed.
When you create a study area, you have an opportunity to name it. When you save the study area, it will be saved with this name. The name is also shown at the top of the "Map Layers" dialog. The Map Layers dialog contains a list of geographic layers in your map.
There are two ways to zoom in on a study area:
- You may use the zoom slider in the main screen to zoom in and out.
- You use the "zoom-once button" to draw a rectangle on the map.
- You are already zoomed in on part of a study area. (For example, the title of the "Map Layers" dialog says "United States", but you are only looking at a 100-mile-high map).
When you are zoomed in, you can scroll the study area around by bringing your mouse to the edge of the screen. An arrow will appear, as in the picture below:
Navigation arrows at corner and sides let you scroll a zoomed-in map
Click the mouse button when the arrow appears, and you will scroll the map in that direction.
The "Panning hand" button is another way to scroll the map in the study area:  You can find this little hand button located below the "zoom-once button" in the picture of the main screen, shown in the next section below.
Look for the panning hand on the left
The reason we are discussing study areas before anything else, even before map layers and map "themes" (collections of map layers that make up the map in a study area), is that it's a fundamental concept.
Also, you need to be able to make a new study area in order to get the benefit of -- or even see -- several useful map features, including detailed streets and Scan/US MicroGrids.
When you "zoom in" to a map, the set of map features remains the same.
When you create a study area, Scan/US will load a new "theme", which can contain map objects more appropriate to a smaller view, such as detailed streets.
You also restrict the scope of objects you are looking at. For instance, you might be looking only at the ZIP codes in the greater Chicago area, rather than all the ZIPs in the country.
But we are racing ahead of ourselves. Let's take a look at two key concepts, and then proceed to the Scan/US main screen.
Two Key Concepts: Active map layer and Toolpad mode button
It's important to understand the key concepts of Scan/US to get a sense of what makes it work. To use Scan/US effectively you need two concepts: knowing which map layer is active and which mode has been selected (see rules 1 and 2 above).
The Active Layer dropdown control, introduced in the next section, gives you control over the currently active map layer.
The Five Toolpad buttons, also introduced in the next section, govern what happens when you click in the map. You can select an object, create a group of objects, put new objects into the map, or measure distance. You can create a new study area.
Section Objectives
- Identify controls on the screen
- Define key terms: menu bar, status bar, Toolpad buttons
- Recognize menu choices on the menu bar
- Identify the layer list box and switch the active layer
- Identify the active toolpad mode (the button is pushed in)
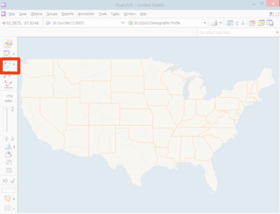
The Scan/US main screen
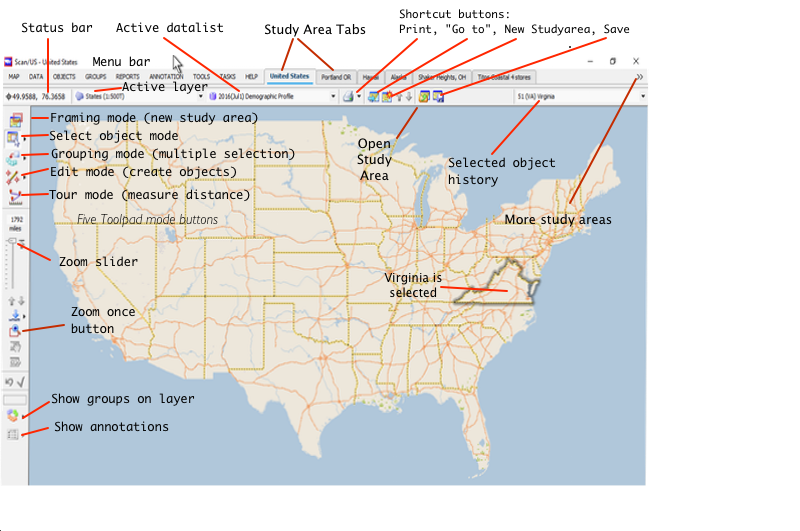
Scan/US main screen
Key Terms
Title bar: Displays the name of the current map window.
Menu bar: Shows the drop-down menus from which you can customize the map, import and export data, make reports and colorful thematic maps.
Status bar: Displays system messages. The latitude and longitude coordinates of the cursor location are displayed when there are no system messages.
A pair of dropdowns in the status bar depict the active layer, and the active datalist on the layer:
Active Layer dropdown: Displays the name of the active layer on the map. When an active datalist is shown in the dropdown to the right of the Active layer dropdown, this indicates that data is attached to the layer. You can change the active layer by clicking on the dropdown arrow and choosing one of the other layers in the list. Scan/US Rule #1: be able to identify the active layer. All operations in Scan/US are performed on the active layer, and therefore, it is critical for you to be aware of the active layer at all times.
Active datalist dropdown: to the right of the Active layer dropdown, this dropdown shows what data is currently showing in Quicklook on the layer. Since the data is connected to map layers, Scan/US Rule #1 is particularly important in understanding how to find data.
Selected Object:
The Selected Object history is at the upper right of the map. It is the place to look when you want more information about the object you have selected in the map.
Five Toolpad buttons:
The toolpad mode buttons are located at the left side of the Scan/US screen. Each mode enables a different set of map operations when you click in the map. Each mode has submodes that are variations of the selected mode. Scan/US Rule #2: be able to identify the active toolpad mode.
Note that there are no automatic actions tied to these mode buttons. Instead, the mode buttons enable a particular kind of functionality--such as object selection--and waits for you to use that functionality.
In other words, first you click the mode button, then you click, or click-and-drag, in the map.
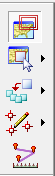
Three of the toolpad mode buttons have "submodes", which you select by choosing the tiny "triangle menu" to the right of the submode button. We will cover these submodes in this lesson.
Menu Summary
This is a summary guide of where to look. A different help file details all the menu choices.
Map
The Map menu has sections related to orientation, study area management, importing your own location layer, changing map layers and their appearance, map themes, and printing or exporting maps.
Data
The features in the Data menu enable you to work with the databases you have licensed as well as your own data. Topics include: Classify by Value, Import and Export Data, and Quicklook.
Objects
All functions in the Objects menu allow you to work with the objects on your map. Topics include: Object Manager, Create Layer, Save objects as, Copy Objects, Export Objects, and Locate in Google Earth
Groups
Functions on the Groups menu allow you to create groups of objects for the purpose of aggregating data, territory planning, and site analysis. Topics include: Group Manager, Groupings, New Group, Group By Object. Groups on a layer are shown at the bottom of the Groups menu.
Reports
You can print profile, comparison, or benchmark reports from the reports menu, or start Site Express to do a bunch of reports at once. A convenient menu choice at the bottom of this menu takes you to the reports output folder, which is further organized by date.
Annotation
Map and Grouping legends are "Annotations", and may be shown or hidden from this menu; here you can create a new annotation or show the map graticule.
Tools
All functions in this menu allow you to modify certain Scan/US defaults. Topics include: The style of symbols, lines and keys that appear in the map, as well as a Projects folder, which helps you manage the various elements of projects for which you import your own files.
Tasks
The functions in this menu give you the ability to run specialized "power user" tasks.
Help
This menu provides different options to access help. Topics include: Contents, Product Support, About Scan/US.
Layers
Each layer on your map contains a specific type of geographic information, for example one layer might contain all the states, another layer might contain all the counties, and a third layer the locations of stores. The term for "all" used in many Scan/US dialogs is "roster".
You can have multiple layers, each containing information. Being able to identify the active layer is the first rule of Scan/US. The Active layer dropdown displays the active layer. To display a list of all the data-bearing layers that make up the current map, choosing Map Layers from the Map menu, and select the "Layers in Map" tab. When a layer has data, it shows a round yellow cylinder to the right of its name, in this list.
Additional "decorative" or "reference cartography" layers can be shown in the Map Layers list by checking the "show reference cartography" checkbox in that Map Layers dialog. These are normally kept hidden (hidden in the list -- you still see them in the map) to make working with the map simpler. You will see that they do not have little round yellow "data cylinders" next to their name.
As we move forward, you'll see that it is important that you be aware of the currently active layer. In order to perform operations on a map object, the map layer containing this object must be active.
To activate a layer
Locate the layer dropdown on your screen.
Click the down arrow button to display a list of layers.
Select the desired layer.
Note: when you select a map object my clicking on it while in Select mode, that object's layer also will become active. We will discuss this in more detail when we get to Select mode.
Census Geographies
The Census Bureau defines specific levels of geography for each census. The standard census geographies used in Scan/US are state, county, census tract, block group, place. Additional census geographies, such as census blocks, are also available.
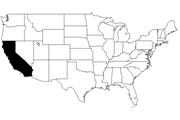
US map, showing states
State
The primary division of the United States. The District of Columbia is treated as a state on the "States" layer.
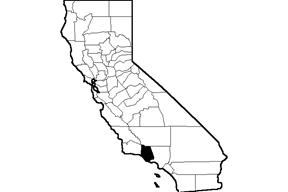
California map, showing counties
County
Counties are the primary political division of most states. In Louisiana, these divisions are known as parishes. There are 3,141 counties in the United States. The District of Columbia is treated as a county on the "Counties" layer.
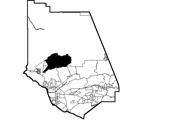
Los Angeles County map, showing census tracts
Census Tract
Census tracts are small, relatively permanent subdivisions of a county. They do not cross county boundaries and contain between 2,500 and 8,000 people. The spatial size of a census tract varies greatly and depends upon how densely populated an area is. There are 64,000 census tracts in the U.S.
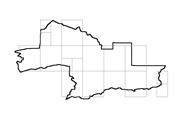
Census Tract map, showing Census Block Groups
Block Group
A Block Group is a cluster of blocks that contain approximately 400 housing units. There are 300,000 block groups in the U.S. (2010 Census); only 225, 000 cover the U. S. population. (This illustration shows the Scan/US MicroGrids within a single block group. Scan/US MicroGrids are described later on in this lesson.)
Census Block Group map, showing MicroGrids
Place (City)
For the purpose of reporting the decennial census data, places include census designated places and incorporated places. Although Places have boundaries, they are also shown as points on a map in Scan/US. Places are divided into six categories according to their 2010 population: Places 500T+, Places 250-499T, Places 100-249T, Places 50-99T, Places 10� 49T, and Places <10T. (T = Thousand).
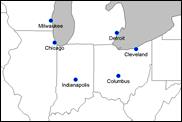
Midwest Map, showing large places
Non-Census Geographies
Non-census geographies are defined by organizations such as the Post Office. These geographies are maintained and modified by their respective organizations and are subject to change without notification.
ZIP Code
ZIP Codes are established by the United States Postal Service for the distribution of mail. ZIP Codes often do not have clearly identifiable boundaries and are changed periodically to meet postal requirements. They do not cover all the land area of the United States. There are approximately 29,000 residential ZIP Codes, 42,000 in total.
map of ZIP boundaries
ZIP+4
Another postal geography tucked away in the "All Layers" tab of the Map layers dialog is the entire inventory of ZIP+4 locations in the US. There are about 27 million of these points and, although they don't carry demographic data, they do show drop counts and could be quite helpful if you are doing mass mailings.
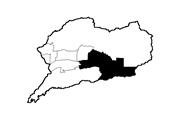
Metro Areas
Metropolitan Areas, defined by the Office of Management and Budget, contain a large population nucleus (minimum population 50,000) along with adjacent communities that have a high degree of economic and social integration with that nucleus. SMSAs consist of one or more counties and may cross state boundaries. In New England MAs are composed of cities and towns rather than entire counties. MAs are relatively freestanding, typically surrounded by non-metropolitan counties.
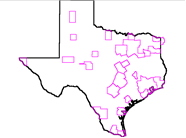
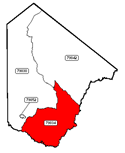
Metropolitan Areas within Texas
Scan/US MicroGrid
Scan/US MicroGrids are a tried-and-true geography that can display demographic detail down to 1/16 of a square mile. Derived from ZIP plus four centroid data except in remote rural areas where they are derived from blocks, two and a half million (2,577,044) MicroGrids cover the entire U.S. population. MicroGrids describe the population distribution within an area. Three grid sizes-small, medium, and large-give you a rough estimation of population density. When the population in a large or medium MicroGrid exceeds 2,000, it is divided into medium or small MicroGrids. Generally speaking, the smaller the MicroGrids within an area, the more densely populated it is.
Scan/US Microgrids are the driving force behind the most realistic data retrieval system for creating ring, polygon and drivetime data. This is because when you create a ring, a polygon, or a drivetime area, Scan/US fills that area up with data from the Microgrids underneath, even when grids are not visible on the map.
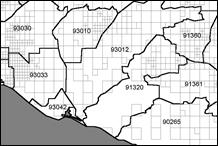
Scan/US Microgrids, overlaying ZIP code boundaries
Location or "Point" Layers
Another type of layer is a location, or "point" layer. A point layer contains two additional fields - latitude and longitude. These fields position the point on the map. Point layers are used to display locations--for example, customer locations, stores or businesses. Public School locations is a sample point layer in your Scan/US Subscription. You can create your own point layers by using the Edit mode or by using the Find Address function from the Map menu. The map below shows locations of two "retro" vinyl record stores in downtown Santa Ana, California, created using Find Address.
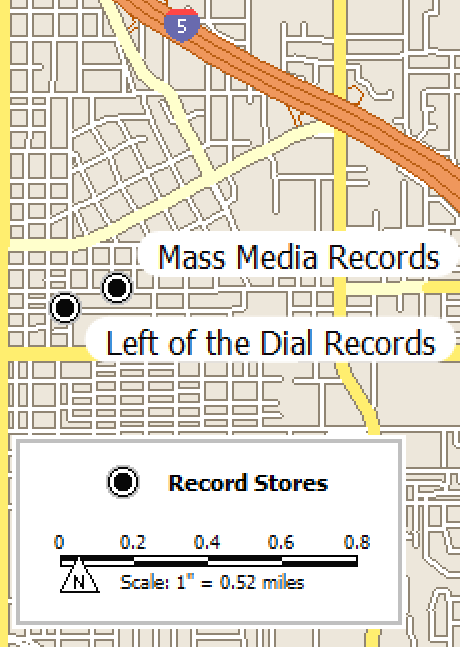
Record locations, shown with legend and scale of miles
Now, before we go on to the next section, it's interesting to note that each of these geographic layers is tied to a specific time period. Some, such as states and counties, change every ten years, while others, such as ZIP codes and Microgrids, change every year. This aspect of geographic layers won't often come up as you use Scan/US, but it may be helpful to keep in mind that 2011 ZIP codes are not the same layer as 2012 ZIP codes, and that this aspect applies to nearly all geographic layers.
An idiosyncratic aspect of geographic layers is that many area layers are also represented by "shadow" or "twin" point layers called "centroids". In Scan/US, the "centroid" is the point nearest to the population center of an object. Thus, the "ZIP centroid" layer is a collection of point ZIP codes, while the "tract centroid" layer is a layer of points that fall within the each census tract area, one centroid per tract. The area/point twins that make up these layer pairs each contain the same demographic data.
It is often very useful to have dual depictions of a geography, one represented by an area, and the same object represented by a point falling within that area. This can be done with the centroid layer and the polygon layer of, for example, ZIP codes.
Toolpad Modes and Submodes
Being able to identify the active toolpad mode is the second rule of Scan/US. Always be aware of the currently active toolpad mode. The active toolpad mode determines the kind of operations you can perform on the current layer. To activate a toolpad mode, click on its button.
Section Objectives
- Identify the toolpad modes
- Identify the toolpad submodes
- Identify the active toolpad mode
Modes and Submodes
The toolpad modes and submodes work on the active layer. It is important to identify the active layer. For example the state layer must be active if you want to create a group of states.
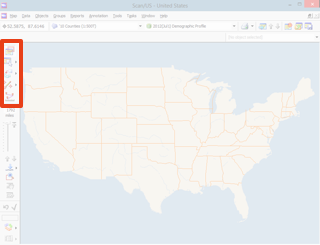
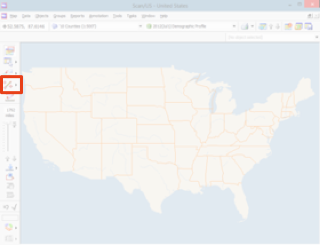
Where to find the toolpad mode buttons
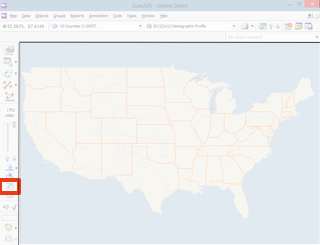
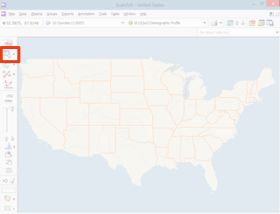
Framing mode
Framing mode is the first of the five modes on the Scan/US toolpad, shown below. It's located to the left of the map, underneath the map menu and status bar, and above the zoom slider.
Scan/US toolpad mode buttons: framing, select object, grouping, edit, and tour(distance)
You can see when a mode is selected by the fact that its "button icon" is shown as "pushed in", as above.
Framing mode helps you to create a new study area or zoom in on a portion of the active study area. There is an equivalent command in the Map menu: New Study Area.
Framing Submodes
Two framing submode buttons appear only after you have drawn the frame. They are shown above the frame in the image below, to the right of the number indicating the vertical size of the frame (here, 134 miles).
These tiny icons are actually submode buttons. The middle one, a small map with a red "asterisk" on it, creates a new study area. It is called "New Study Area submode".
The one on the right, a "plus" sign inside a magnifying glass, will zoom in on the map without creating a new study area. This is "Zoom in" mode.
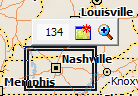
drawn frame with two submodes in a 134-mile-high frame
New Study Area is used to create a new study area from the existing framing rectangle.
Zoom is used to magnify and zoom in on the selected area without making a new study area.
So, here is the question. Which submode should you use? Since making a new study area is not a big deal, you should probably choose the middle button most of the time, and create a new study area.
You will be given an opportunity to name the study area, and to choose a theme. This is how you get streets to show up on your map. There are plenty of pre-defined themes, so you will almost never have to define one, even though it's possible to do so.
"Select object" mode (and its submode "Select label")
The select mode is often referred to as the "pointing-arrow" mode. You use this tool to select objects or labels on your map.
Where to find the Select Object mode button
When you click the small black 'menu triangle' next to the Select Object mode button, two choices appear. When you choose one, its little picture replaces the one in the Select Object button. (The same thing happens with grouping mode and edit mode, so you will always know which submode you have chosen, just by looking at the mode button.)
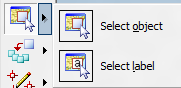
The two submodes of Select object mode
Select object is used to select an object by clicking on it.
Anywhere you click in the map, an "in-map-menu" 'decision tree' pops up right in the map. This lets you select an object on any layer. When you select an object, that layer becomes active.
Here is what the "in-map-menu" looks like:
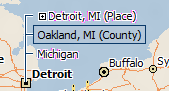
Select object mode 'selection tree' which appears when you click in the map.
The objects on different layers form a menu -- you can select any one of them, as in the tree above, where "Detroit," "Oakland County," and "Michigan" can each be selected.
This list is a tiny menu and it can be quite subtle in appearance. In fact, we picked Detroit because it pops up over a lake area so you can see the choices. Here, Oakland County is highlighted by the mouse, even though you cannot see the mouse pointer in the picture.
When you choose one of the objects you switch to that layer automatically. So, choosing Oakland County will switch to the county layer, and the active layer dropdown will change accordingly.
Just keep in mind Scan/US rule number 1: 1: Be able to identify the active map layer. This is a way the active map layer can change!
Select label mode is used to select a label by clicking on it.
When you have selected the label, it will highlight in red, as below, with the city of Memphis TN. You will not be able to move labels around (either accidentally or on purpose) unless you are in Select label mode.

Selected label (Memphis TN) highlighted in red
When you have selected the label, you can move it to a different location in the map. When you do this, notice that any labels in the way, move out of the way when you reposition the label.
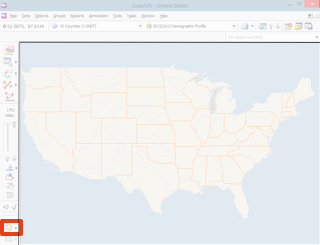
Assign object to group
Find grouping mode here

grouping mode
Grouping mode supports a fundamental capability in Scan/US--the classification of objects on a layer into distinct subsets. Objects assigned to a group are treated as a single unit.
This is how Scan/US does "multiple selection", so if you ever need to select more than one object at a time, you can do this by making a group of objects.
A collection of groups is called a "grouping", and the rule is that an object within a grouping can be a member of only one group at a time. In other words, groups within a grouping can't overlap.
The other fundamental principle of groups and groupings is that they are national in scope. In other words, you can create a group of (for example) three high-income ZIP codes, one in Chicago, one in San Francisco, and one in Miami, and even though you are looking at your group in one of the individual study areas, it will still have 3 members. This point will not come up very often in practice, but it is fundamental to groups, so you should know about it from the beginning.
Grouping Submodes
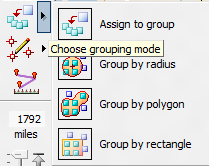
Assign to group is used to add objects to a group, one at a time, by selecting them. Click on the object to select it, then when you click again, it will go into the current group. If no group exists, you will be prompted to name one.
Group by radius is used to group objects by drawing a ring around them. The ring is drawn out from the center of the desired grouping.
Group by polygon is used to group objects by drawing around them with a free-form polygon.
Group by rectangle is used to create a rectangle-shaped group. Choose this mode, and draw from upper left to lower right (or vice-versa) to create a group.
This would be a good time to review Scan/US rule number 1: be able to identify the active layer. When you start to create a group of ZIP codes, make sure you are on the ZIP layer. When you want to create a group of counties, look at the active layer drop-down to make sure you are on the counties layer.
In other words, make sure you are on the layer you want to group.
Grouping is interactive, and you can switch between grouping submodes while remaining in the same group.
Many dialogs in Scan/US offer the option "Objects in checked groups", so if you know how to make a group, you can really unlock a lot of the power that Scan/US has to offer.
A wonderful aspect of groups in Scan/US, is that when you create a group, Scan/US automatically totals the demographic variables for the group, and you can look at it "live", in Quicklook (found on the Data menu), while you are assigning objects to the group. This ability, to see the demographic total of a group of, for example, ZIP codes,is a favorite feature of people who use Scan/US to create franchise trade areas.
Edit mode
The Edit mode is used to create new objects or to modify the definition of an existing object on an editable layer.
Notice a little yellow command, "Choose edit mode", in the illustration below. This is a "tooltip," and one of these will appear when you "fly your mouse" over any of the buttons in Scan/US. This is a good way to refresh your memory about the meaning of one of the iconic Scan/US buttons.
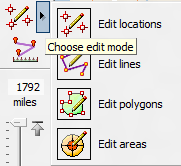
Edit Submodes
Locations is used to create a location or select the location you want to edit.
Lines is used to create a line object or select a line to edit.
Polygons is used to create a polygon or select a polygon to edit.
Areas is used to create a ring area or select a ring area to edit. Drivetime polygons, even though they are polygons, are created as "Areas".
There are two wonderful characteristics of layers created through edit mode.
These layers are "autosaved" when you make changes. Thus, when you first click in the map to make a point, or a ring area, or complete a polygon, you will be prompted for a filename. After that, you won't have to worry about saving. Scan/US will do it for you.
For rings, drivetimes, and polygons you draw yourself, demographic data fills the area automatically.
Tour mode / Measure distance
When Tour mode is the active mode, Scan/US calculates the distance between points you click on the map. Tour/Distance has no submodes.

The "tour" line goes away when you click another mode, or click somewhere out of the map. When you click inside the map, the tour continues, displaying distances of each leg of the tour.
Databases
Depending upon your license agreement you will have a variety of databases available to you. Some databases work for specific layers. A good way to familiarize yourself with your databases is to identify which databases you've licensed and then examine them directly.
Section Objectives
- Identify available databases
- Look at data through QuickLook
- Switch layers and identify databases
Scan/US Subscription Databases
There are several core databases included in your Scan/US Subscription. Many add-on databases are available--demographic updates (current year estimates/5-year projections), consumer spending potential, business data, MOSAIC lifestyle segmentation, and a few more than we can fit here. You can find out more about these databases from the Scan/US website at http://www.scanus.com, the Scan/US data portal at http://www.mapdata2go.com or by calling us at Scan/US.
Something to remember: Databases are provided for specific levels of geography, and you may not see the same databases listed for all levels.
None of the road geographies--detailed streets, major roads, major intersections, or U.S. Interstates--have databases. These maps are most useful in adding orientation information to your maps. Some databases included in the Scan/US Subscription are:
1990/2000 Demographic Change
Selected summary 1990 and 2000 census population, income, home value. Provided for states, counties, MSAs, Block groups, Places, ZIP centroids, and Scan/US MicroGrids.
2000 Demographic Profile
2000 census demographic data compiled from the Bureau of the Census' Summary Tape File 3.
Current-year Demographic Update, with 5-year projections
Average, aggregate, median income estimates, income distributions by households and families; housing characteristics; and educational levels attained.
Current-year Consumer Spending Potential
Average and aggregate household expenditure potential, for a wide variety of types of household expenditures.
Postal Delivery Counts
Scan/US shows USPS postal delivery counts for active residential and business deliveries, and a residential address count for apartment and non-apartment addresses.
2010 Census Tables at all levels of geography
Scan/US now includes Census 2010 data -- it is matched to the Census 2010 geography layers, which are not yet the default map layers. In order to see these databases, you will need to open Map Layers from the Map Menu, click the "All Layers" tab, and navigate to the category "Census 2010 Area Polygons". Check off the 2010 States, or 2010 Counties, and you will be able to look at the data items from all of the following Census 2010 tables:
2010 Census: Race, Hispanic
- P3: Population by race (8 data items)
- P5: Hispanic by race (17 data items)
- H6: Households by race (8 data items)
- H7: Hispanic households by race (17 data items)
- H14: Households by tenure and race (17 data items)
- H15: Households by tenure and Hispanic (7 data items)
2010 Census: Housing [19 items in file P10]
- H3: Occupancy status (3 data items)
- H4: Tenure (4 data items)
- H5: Vacancy status (8 data items)
- H11: Population in units by tenure (4 data items)
2010 Census Tables at state, county and MSA only:
SF1 Focus on Age
2010 Census: Age of Population [95 items in file P1]
- P12: Age by sex (49 data items)
- P13: Median age (3 data items)
- P14: Age by sex, population <20 years (43 data items)
2010 Census: Age of Household Population 49 items in file P6
- PCT13: Household population by age by sex [49 data items]
2010 Census: Householder Age [142 items in file P7]
- P21: Householder age, presence of related children (31 data items)
- P22: Household type by householder age (21 data items)
- H17: Tenure by householder age (21 data items)
- H18: Tenure by household type by householder age (69 data items)[H18]
SF1 Focus on Households, group quarters:
2010 Census: Household Size [50 items in file P3]
- P28: Households by type and size (16 data items)
- H13: Households by size (8 data items)
- H16: Households by size by tenure (17 data items)
- P17: Average household size (3 data items)
- P37: Average family size (3 data items)
- H12: Average household size by tenure (3 data items)
2010 Census: Household Composition [170 items in file P4]
- P18: Household type (9 data items)
- P19: Household type by presence of own children (19 data items)
- P20: Households by presence of people <18 (34 data items)
- P23: Households by presence of people 60+ (15 data items)
- P24: Households by size and presence of people 60+ (11 data items)
- P25: Households by size and presence of people 65+ (11 data items)
- P26: Households by size and presence of people 75+ (11 data items)
- P38: Family type by presence of own children (20 data items)
- P39: Family type by presence of related children (20 data items)
- P40: Family type and age for own children <18 (20 data items)
2010 Census: Household Population [144 items in file P5]
- P16: Household population <18 and 18+ (3 data items)
- P29: Household population by relationship (28 data items)
- P30: Household population by household type (13 data items)
- P31: Household population <18 by relationship (16 data items)
- P32: Household population <18 by age and relationship (45 data items)
- P33: Household population <18 excl. householders (7 data items)
- P34: Household population 65+ by relationship (22 data items)
- P36: Population <18 and 18+ in families (3 data items)
- H19: Population <18 by tenure excl. householders (7 data items)
2010 Census: Group Quarters [73 items in file P8]
- P42: Group quarters population by type (10 data items)
- P43: Group quarters population by sex by age by type (63 data items)
2010 Census: Group Quarters Detail 227 items in file P9
- PCT20: Group quarters population by type [32 data items]
- PCT21: Group quarters population by sex by age by type [195 data items]
To Identify the Databases
- Click the Datalist dropdown. The databases available for the currently active layer are listed. The active datalist is always listed in the #1 position, and you can change the active database by clicking on the name of another database in the list.
QuickLook
QuickLook is used to view the data for a selected object. You can switch from one database to another while QuickLook is active to review different data variables.
Two ways to activate QuickLook
�1. From the Data menu, choose QuickLook. Review the data variables which are shown.
- Right-click in the map, and a "context menu" will pop up. You can choose Quicklook: it's the first choice in the menu.
Quicklook will show data values for the currently selected object on the active map layer. The currently selected object is shown in the "Selected Object history" dropdown, which is at the upper right of your map window.
Switch layers and identify databases
When you switch your active layer, the available databases change. Data is automatically available for most levels of geography, but not all.
For example a layer containing store locations would not have population data; stores don't have populations. However, when you load your own data, for example from an Excel file of store locations, you might have sales data for each store. This would show up as a datalist for your layer.
The help topic "Working with Excel" explains how to do this.
To switch layers and databases
�1. With the QuickLook dialog open, click the Active datalist dropdown. Select a different database from the one that is showing. Observe the changes in QuickLook.
�2. Switch your active layer from States to Census Places, or to Counties. Observe the changes in QuickLook.
Section Objectives
- View Census terms and database definitions
- Answer questions with help files
- Identify answers to common questions
Section 1 Exercise
You've learned a lot about the basics of Scan/US in this session on basics. Here's an opportunity to reinforce this new information with practice, assuming you haven't already been following along with Scan/US on your computer as you read.
Some basic exercises for you to do
�1. The Active Layer dropdown is located in the status bar of your screen, below the menu bar. Locate the Active Layer dropdown and identify the active layer.
What is the active layer? __________________
�2. Click the down arrow to the right of the active layer to see a list of available layers. Click on Place Centroids.
�3. Choose the Tour/Distance tool. Click on New York and then click somewhere in California. How many miles apart are they? ___________
�4. To select Boston, switch to the Select object mode tool and click on the dot that represents Boston in the map. What's the latitude and longitude of Boston? _________________ What's the active layer? ___________
�5. Choose the Select|Label tool. Make your active layer States. Click and drag the Florida label to a new location.
�6. Select Texas. Choose the 2011 Demographic Profile database from the current datalist dropdown. What is the current population of Texas? _______________
Summary Review
Since people tend to remember things they review, and things that come at the end of a chapter, let's go over some of the basic concepts again.
Layers in map
Since Scan/US is organized to present demographic data through a map interface, it makes sense to know how the map is put together. It is put together of layers of objects, each layer containing objects of a similar type.
States, Counties, Census Tracts, Census block groups, census blocks, ZIP codes, and Scan/US Microgrids are each contained on their own layer, and they all contain data. Streets, Highways, lakes, rivers and streams are all on their own layers, and don't contain data.
When you create your own editable objects in a map (using edit mode), whether it be points, lines, polygons, or areas (either rings or drivetimes), then each of these kind of objects are on their own layer. The areas and polygons which you create get their demographic data from the Scan/US Microgrid layer, and this happens, for the most part, automatically without your intervention.
You can import latitude-longitude based location layers into a map, from an Excel or other data file. When you do this, each location can have its own data associated with it (in addition to the latitude-longitude coordinates), just by putting it on the same row as the coordinates, in the same file. The set of locations becomes a map layer, and you can customize the look of the points on the map.
Scan/US Rule 1: Be able to identify the active map layer.
Active Layer dropdown: Displays the name of the active layer on the map, and lets you change the active layer.
Grouping rule and grouping facts
Groupings are how Scan/US does "multiple selection", both for output and for 'filtering' or restricting a choice of multiple objects for a next operation: exporting data for, coloring in, making a copy of the objects, etc.
A collection of groups is called a "grouping". Here is the grouping rule: an object within a grouping can be a member of only one group at a time. In other words, groups within a grouping can't overlap.
A fundamental fact about groups and groupings is that they are national in scope.
Scan/US automatically calculates totals for all variables in your groups, except for 'stat' variables such as averages and medians, in which case it "does the right thing" and calculates the average or median value for the group.
Groups which you create are auto-saved. (This is why a box pops up when you create a grouping. It gives you the chance to name the file the groups are saved in.)
When you create a grouping, remember to check that you are on the correct map layer!
To see groups on a layer, click the "show groups" button just underneath the red "grouping operations undo" button.
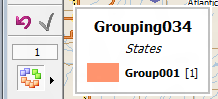
the red 'undo' arrow 'undoes' the last grouping operation
That's right, grouping has an "undo" button! It only shows up just after you have added objects to a group. It works on the last grouping assignment that was done.
Study Areas vs. Zoom
There are two ways you can tell that you are zoomed-in on a map:
- The title of the "Map Layers" dialog says "United States", but you are only looking at a 100-mile-high map).
- The zoom slider at the left of the map is not at the top of the zoom range: it is in the middle or at the bottom.
A study area is the market area you want to analyze. If you have just "zoomed-in", you have not isolated the study area.
The default study area is a map of the continental United States. You can select any map you want as the default start-up map. In the "Open Study Area.." On the map menu, click the checkbox at the bottom: "Load first on startup".
You can't modify the main US study area; this keeps you from "messing up" the startup map. (You can make a copy, though, using "Save Study Area as..").
To see low-level map features like detailed streets, make a new study area. Use framing mode to delineate your area, then double-click inside the framing rectangle (or choose "New Study Area.." from the map menu) to make a new study area.
Whether you click the new study area button, or choose "New Study Area.." from the map menu, you will get a dialog similar to the one shown below, but with themes from only one "zoom range":
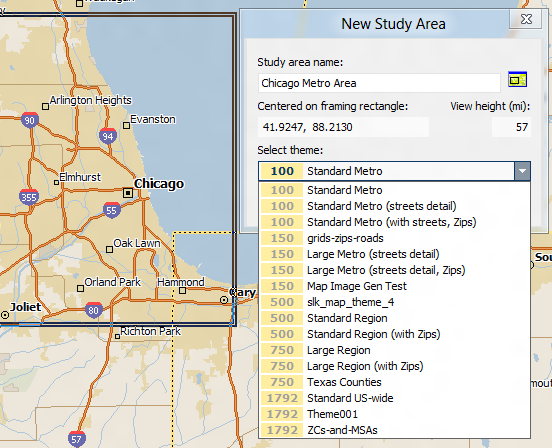
New study area dialog, showing available pre-defined themes
If you want to see themes available for a different "view height" -- for example 150 miles, simply type "150" into the "view height" field, and those themes will show up. The full range of view height themes, as shown in the dialog above, is available to use, but will not actually be shown in the New Study Area dialog.
When you "zoom in" on your active map, the set of map features remains the same (although their characteristics may change). But when you create a new study area you will see the available "map themes" that are appropriate to the view height of the map you create.
For the new study area, Scan/US will load this new "theme", which can contain map objects more appropriate to a smaller view, such as detailed streets or MicroGrids.
In a smaller study area, you also restrict the number of objects you are looking at. For instance, you might be looking only at the ZIP codes in the greater Chicago area, rather than all the ZIPs in the country. In terms of the demographic data presented, this facilitates finding (for example) the highest per capita income in the Chicago area, rather than over the whole USA.
Two key concepts: Mode buttons and the active mode
There are five mode buttons at the left of the Scan/US main map window: framing mode, select object mode, grouping mode, edit objects mode, and tour mode. The active mode is shown by the button that is "pressed in". One of the modes will always be active.
Framing mode is used for creating a new study area OR for zooming in. After you draw your framing rectangle, double-click inside the rectangle to create a new study area.
Select mode is used for choosing an object -- on any layer -- or for selecting and moving the label of an object on the currently active layer.
Grouping mode is used to create new groups on the currently active layer. Its submodes (and you can switch between them during your work) determine whether the grouping is done by radius, drawing a polygon or rectangle, or one by one.
Edit mode is used to create new location, line, polygon, or area objects, by clicking them into the map directly, or to edit existing editable objects.
Tour mode is used to measure distances between two points, or several points one after another in a "tour".
Help topics
This help topic is one way to get started.
We suggest you go through the other help topics, looking at particular the single-object reports, and multiple-object reports, the survey of all the Scan/US menus, and the tour of Quicklook. Since the current topic is linked-to from the other topics, you can just step "back" in your browser and continue on to these and other, more-specialised topics.
There's a lot you can do with Scan/US, and more to learn. There are also screencast movies, designed to be used along with the Basics 1-2-3-4-5 series of topics.
Site Express
Now let's take a brief look at a Scan/US automatic facility that "walks you through" creating a demographic report centered on a specific location.
At the end of this section you may find links to other ways you can use Site Express.
To choose a three-ring report (or multiple-ring or multiple drivetime report) based on an address, a selected point (or layer) or a latitude and longitude, start Site Express.
We are only going to show how to use Site Express with a street address in this short orientation to different kinds of reports.
Site Express can be set to Launch on startup, which means it will always start when you start Scan/US. Here, start Site Express from the Reports menu:
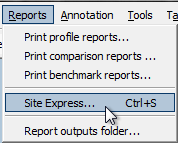
Choose Site Express... from the Reports menu
You do not need to have selected an object before starting Site Express. But ... if you DO want to do a site report on the currently selected map object, you can choose the "Selection" tab (shown below between "Address" and "Lat/Long") after you have launched Site Express.
Site Express step 1: choose objects for your reports
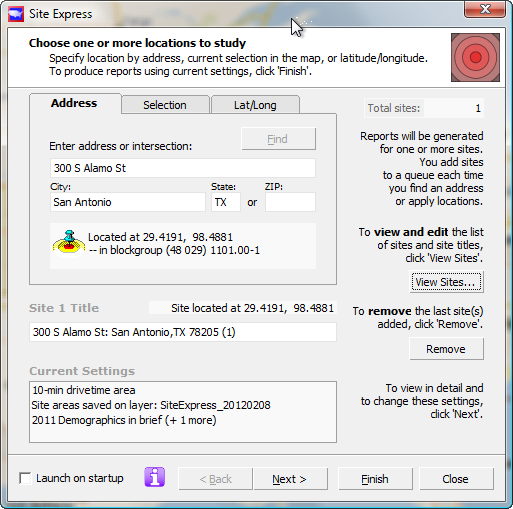
Choose the objects for the reports
The panel above shows Site Express after an address has been entered and the "Find" button was pressed. The little blue pin in the middle of the target shows how good a job it thinks it did in finding the location. If the pin is not in the middle of the target, then the location may not be quite correct on the ground.
You should enter "300 S Alamo St, San Antonio, TX", and press the Find button.
At this point, it's worth noting that you can enter MORE addresses, and the "Total sites" readout in the upper right of the panel will show the number of sites you have entered. You can look at this list and change the naming, or delete sites, by pressing the "View Sites..." button. We are not going to show a picture of that here -- it is pretty obvious how it works, when you need it. You are not limited to doing reports one address at a time.
Before you press the "Next" button, look at the "Current Settings" box at the bottom of the panel. It shows the settings from the last time Site Express was run, and you can use them again on this run of Site Express by pressing "Finish."
Here, the "Current Settings" box shows a ten-minute drivetime, the layer where the new areas will be saved, the number of reports, and the name of the first one: "2011 Demographics in Brief."
Since we are going to do rings, not drivetimes, we will press "Next."
Site Express step 2: define the shape of the site area
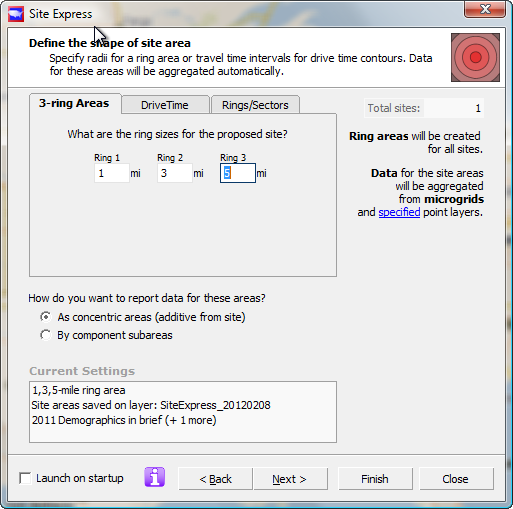
Define the shape: rings or drivetimes
The panel above shows Site Express after 1-3-5 has been entered into the ring-area tab. You can see that the "Current Settings" box at the bottom has changed to show a 1-3-5 mile ring area.
Here again you have a choice to print the report immediately by clicking "Finish", or click the "Next" button if you want to specify a different report. Click "Next".
Site Express step 3: select reports to print or save
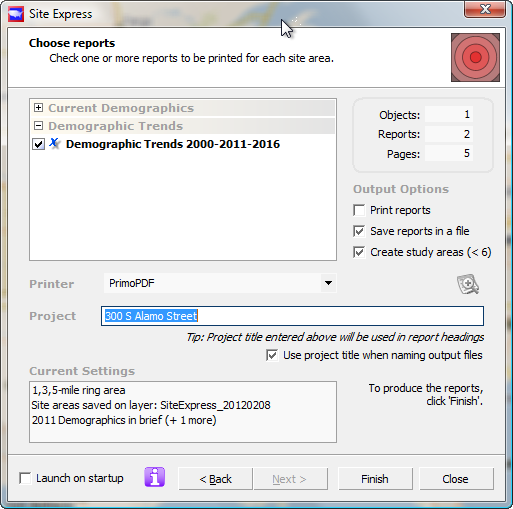
Select the reports to print and/or save
Finally, you can choose your reports and click "Finish".
Before you DO click 'Finish', you can set the option to print the report, or save it in a file, or both.
The third checkbox controls the creation of study areas. When you are doing less than 6 sites, you can cause Scan/US to create a new study area for each site. This is to avoid cluttering up your system with study areas. If you wish to print a map of the report sites, however, you will need to create a study area for the site, and then print it later.
Summary information is shown about the number of sites, and the number of pages in total. If you are printing multiple reports for a large number of sites, your output file will be split at 200-page increments, so that it is more manageable. The file in this exercise will not be that large, but in cases when you have output 1,000 reports, you might like to know that there is a "batch report manager" which will help you find your report if you happen to have generated a lot of them.
Site Express step 4: where are the study areas?
Finally, if you have asked for study areas to be created, where can the maps be found?
The answer is that your study areas are in new Study Area Windows, in the tabs to the right along the menu bar. By choosing a study area from the tab, you call up its map, and from the Map menu you can choose "Print" or "Export image.." to print the map or export the image to a ".png" file.
Site Express step 5: where are the ring-area layers?
Since all map objects are contained in layers, our Site Express story would not be complete without a discussion of the rings. Recall the "current settings" box at the bottom of Site Express:
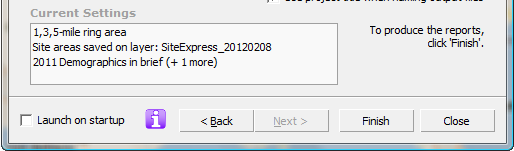
Current settings showing name of ring layer "SiteExpress_20120208"
Above you can see the name of the ring layer in the format "Year-month-day", "SiteExpress_20120208". A report on the same day would generate the layer name ""SiteExpress_20120208(001)" and subsequent reports would be numbered consecutively.
If you want to bring these rings back again, you can a find the list underneath the "SiteExpress Sites" category in the "All layers" tab of Map layers.
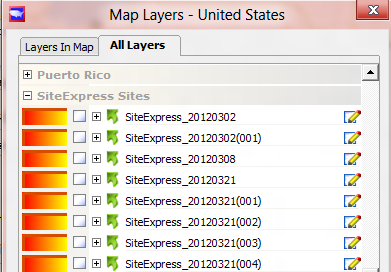
Map Layers dialog showing SiteExpress Sites layers
Choose "Map Layers" from the Scan/US map menu and click the "All layers" tab to get to the dialog shown above.
Site Express, in conclusion
This concludes our introduction to Scan/US Site Express. There are other ways to create reports in Scan/US, and other types of reports, too.
The clickable links below will take you to information on other single-object reports, reports that take multiple objects into account, and other uses for site express.
Other reports you can make, which focus on single objects
There are reports such as the distance report, which focus on multiple objects
Without making reports, you can use site express just to create concentric rings
As we mentioned, you can make a report on page one of Site Express
Back to the main overview:
- You can find other topics covered in the main overview page on how to use Scan/US
in Basics 2, we will go deeper into what makes study areas, and how to customize map layers.