Three-ring site reports with "Print Comparison Reports"
This short Scan/US "step by step" shows how to create three-ring site reports with this sequence:
- Set up the rings using "Find Address"
- Add the rings to a ring layer at the same time
- Select the innermost ring
- Choose "Print Comparison Reports" from Reports menu
- Clear previous setting
- Choose the report, then press the otherwise hidden little button "..."
- Select the 2nd and 3rd and forth column as the other two rings
- Save the report to Excel
- Compare the numbers using Quicklook (Data menu)
- Print the reports from Excel
An additional section recaps the section from "Multi-object reports", which shows how to use Comparison reports in a different way, to compare completely different objects and groups.
Setting up the rings
To make it easier to see where your rings are located, and easier to compare using Quicklook, to the final reports, draw a rectangle and create a new study area.
Tip: the drawn rectangle is in the same shape as the Scan/US map window. If you want the map to be more up-and-down, resize the window before you make your study area.
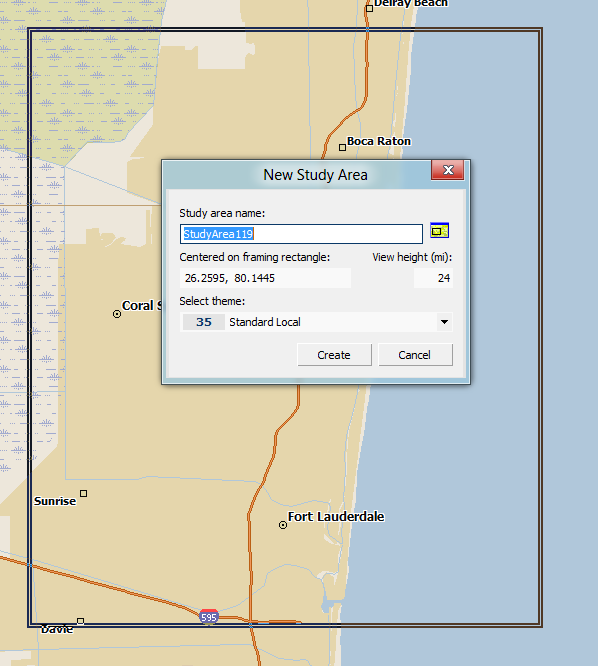
Create a new study area
Next, from the Map Menu, choose Find Address. But even before you put in your first address, create the target layer for your rings. To do this, choose [New Areas] from the "Target Layer" dropdown. The Create Layer -Areas will pop up and you can name the layer (here shown as Coastal Coin Laundries), and put in the ring sizes that you will use.
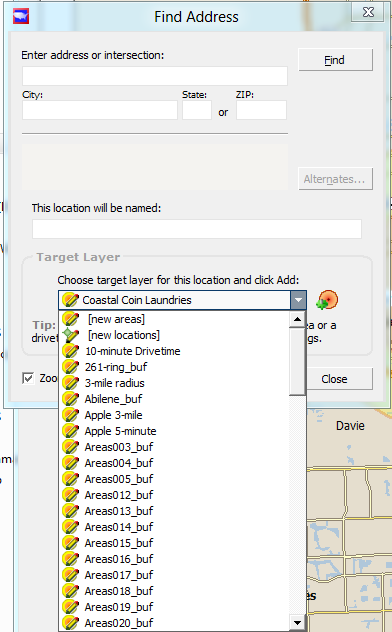
Click 'New Areas'
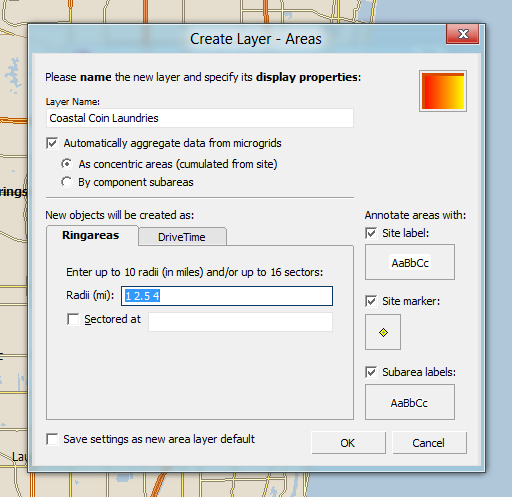
Name the layer, and specify the ring sizes
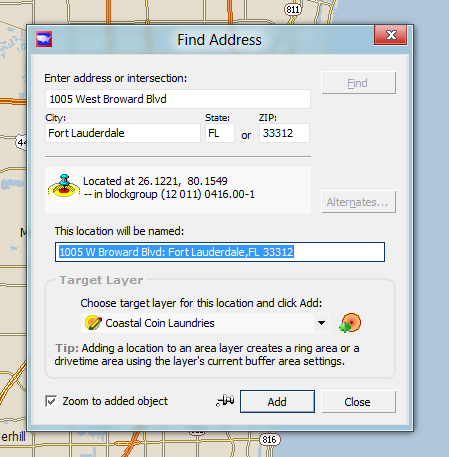
Now, enter the first address
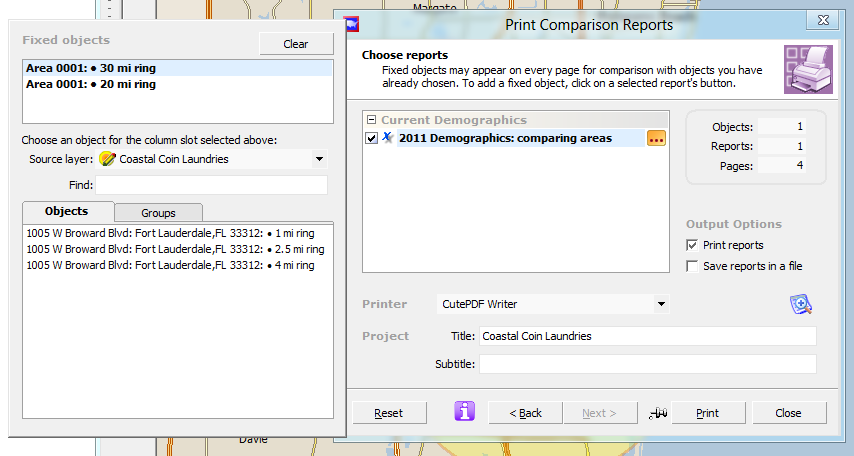
After you enter your address, and click "Add", it will add the layer to the map. You can see that the outermost ring is selected. You need to click on the inner ring to select that for the comparison.
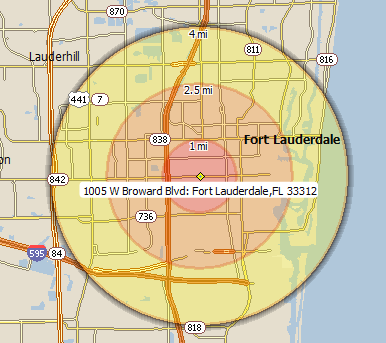
Select the inside ring
Click 'Select Object' mode button, and then click in the inner-most ring to select.
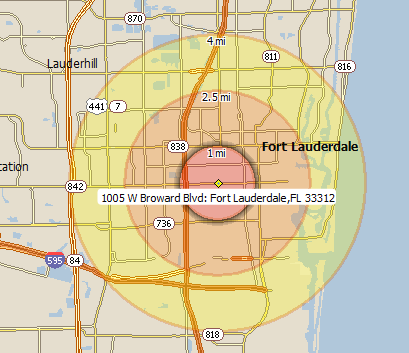
The one-mile ring is selected
Now that the one-mile ring is selected, choose "Print comparison reports" from the Reports menu:
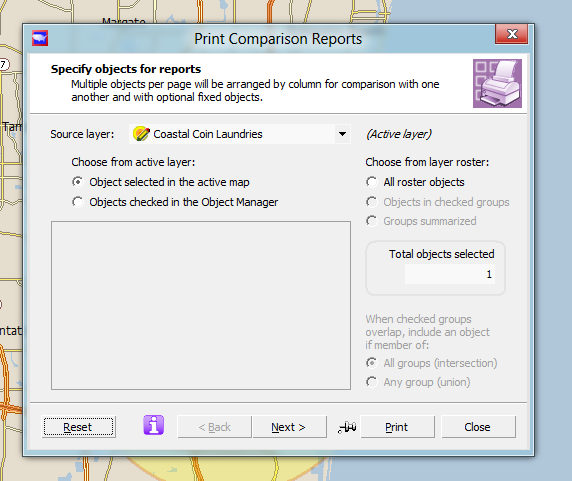
Make sure "Object selected in the active map is the option"
Make sure "Object selected in the active map" is the option above (If an object is selected in the map, that's the default selection). It will show "Total objects selected: 1." Click "Next" to go to the next page and select the report.
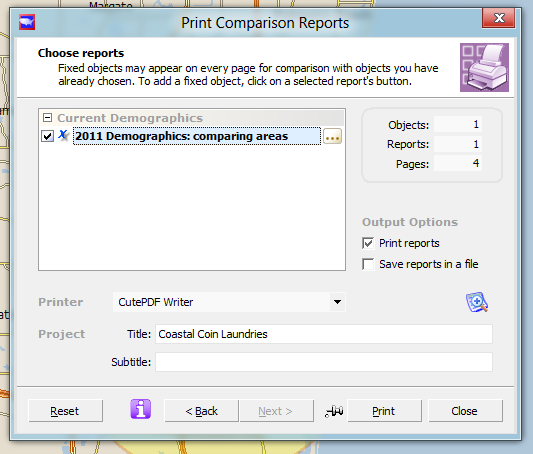
Choose the report and the "..." button will appear.
Once you have chose the "2011 Demographics: comparing areas" report, by clicking on its name, a three-dot button will pop up next to it, colored amber. When you click on this button, the 2nd-column & 3rd-column chooser will pop out to the left, as below:
First press the clear button!
As you can see, there are two other objects specified, left over from a prior run of this report. Press the "clear" button, to get the instructions back, as below:
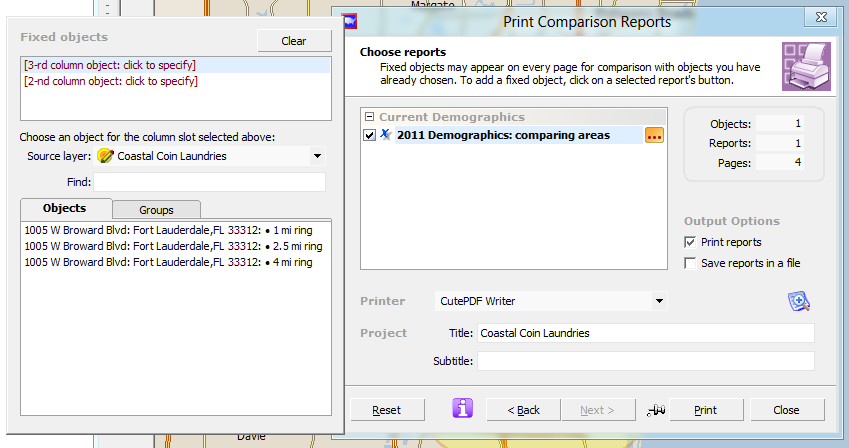
First click 'click to specify', then click the object
After you have pressed "clear", you will see the instructions in the upper left:
First, you should click the 2nd column red text, and after that, choose the object that will fit in there.
Since the 1-mile ring is already specified as the "selected" object, at this point you will choose the 2.5 mile ring object in the "Objects" tab below.
It will fill in like this:
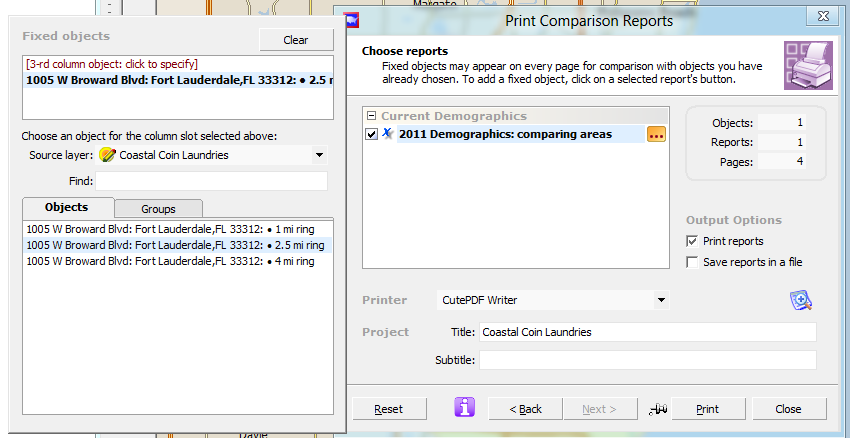
2nd-column object has been selected
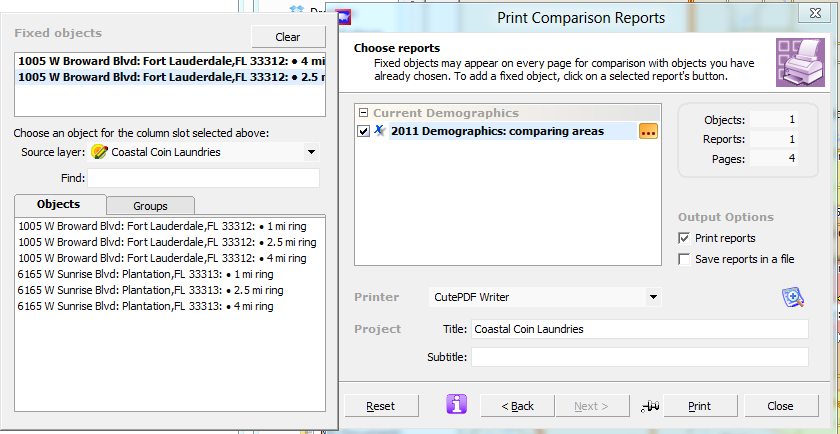
After the second column is selected, you repeat the process for the third column, and your panel will look like the picture below:
(Also, notice that "Save reports in a file" has been checked, and "Print reports" is UN-checked. And -- one more thing -- the Subtitle "Broward Blvd" has been filled in, and this will show up on each page, too).
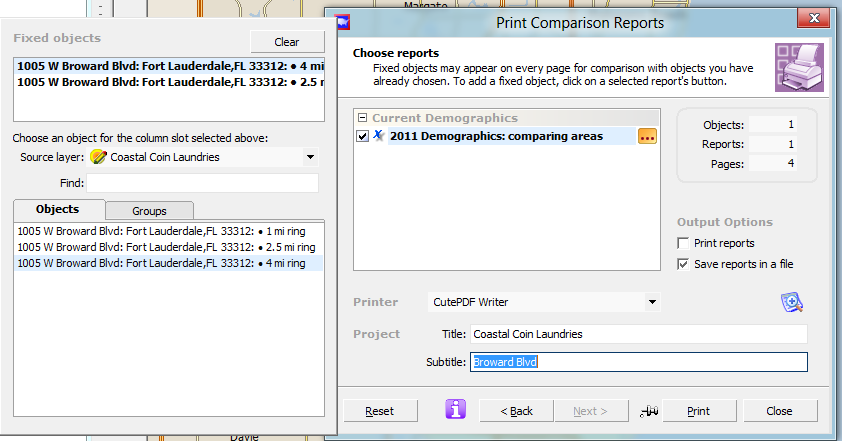
Almost ready to hit "Print"
Actually, you are ready to hit "Print"
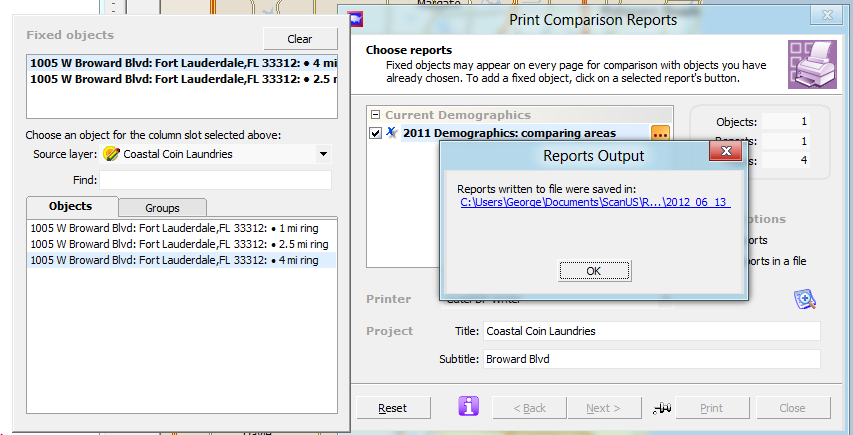
"Reports Output" shows where the report was saved
Click the blue link to bring up Window Explorer, and it will show the files created so far.
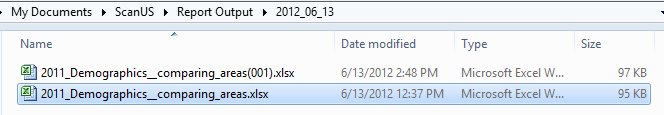
Choose the most-recent rendition to get your report
If you click on "date modified", it will show the files in date-sorted order, so you will be able to select the most recent one.
Since you have set up comparison rings by hand, it makes sense to make sure your assignments were correct.
Look at the rings with Quicklook to make sure it matches your report. To do this, from the Data menu, choose Quicklook, and use the dropdown at the top to switch between rings.
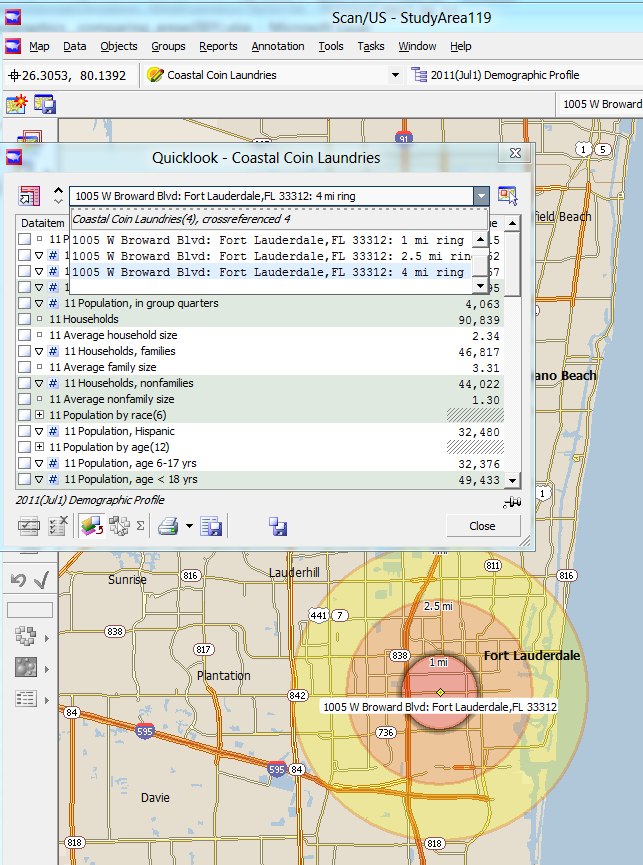
Look at each ring with Quicklook
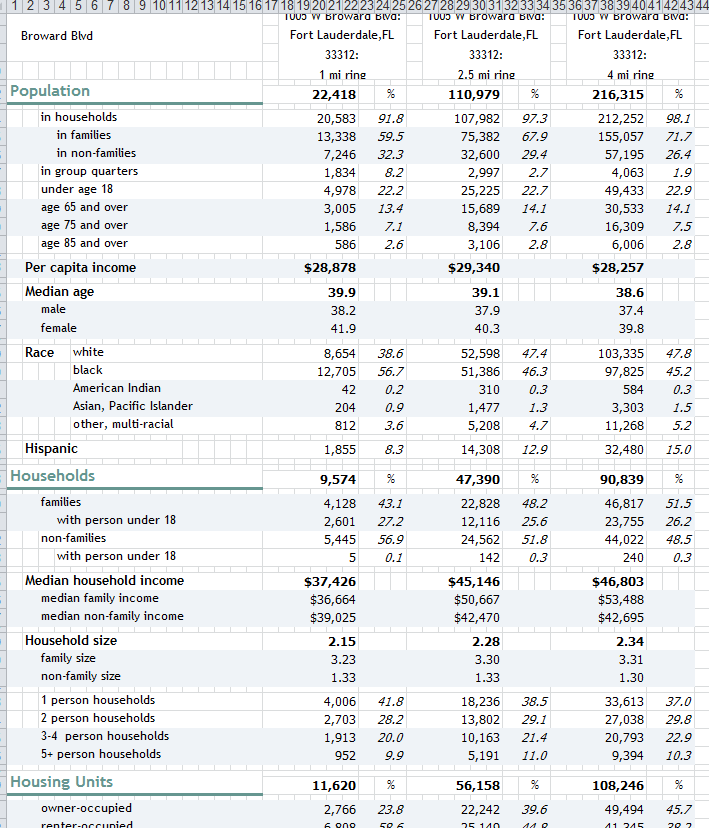
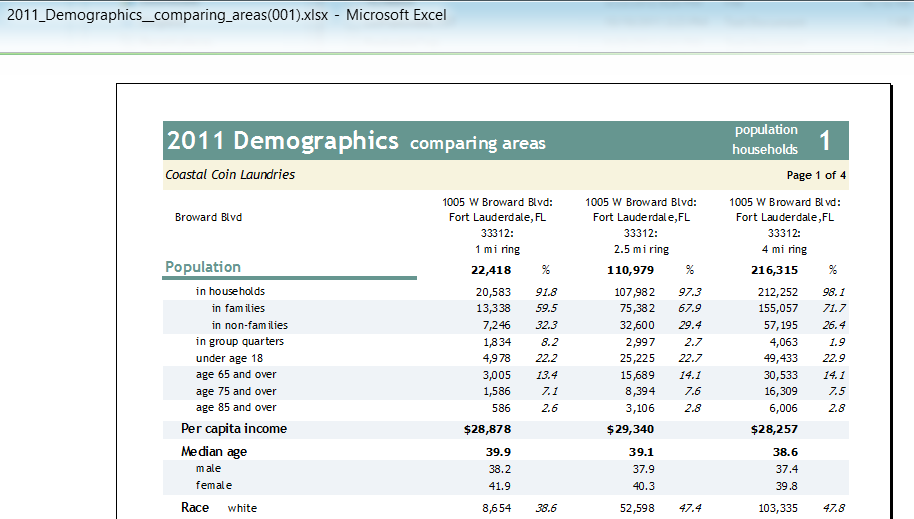
When you double-click on the report, it will bring up Excel and show your data:
Open the report
It isn't shown side-by-side on this page, because it would be too wide, but you can see that, for example, the average household size for the 4-mile ring, 2.34, is the same in Quicklook as in the report.
Compare the ring's data before printing
Once you are satisfied that you have got the right numbers, for the right location, go ahead and print your report from Excel, choosing "Print" from the File menu. Or, you may have added a "printer button" shortcut to your shortcuts bar.
Chose "Print" from the Excel file menu
What's next? Do it again with a new location!
The following location, 6165 W Sunrise Blvd, does not address-match exactly. The blue pin is off-center of the match target. It will only be as close as the nearest ZIP-plus-4 centroid. At this point, you may not wish to do a report, but to make sure it is located more precisely. However, since this example is about churning out reports, we will skip that aspect.
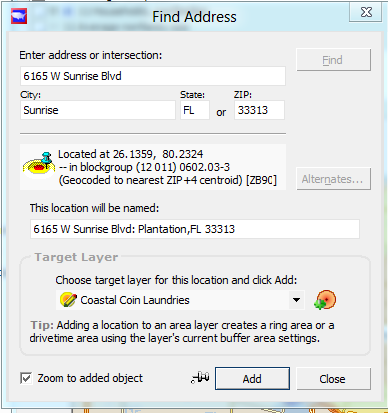
This site shows an almost-address-matched location
Click "Add", and then, from the Reports Menu, choose "Print Comparison Reports".
Press CLEAR to make sure you don't use the ring from the first site!
Notice that the ring objects from the last run are still filled in. Press "Clear" to clear them, otherwise you will not be comparing the right rings. Notice in the figure below that the current selected object "6165 W Sunrise Blvd: Plantation FL", is shown in the current-selection dropdown at the upper right of the Scan/US map window:
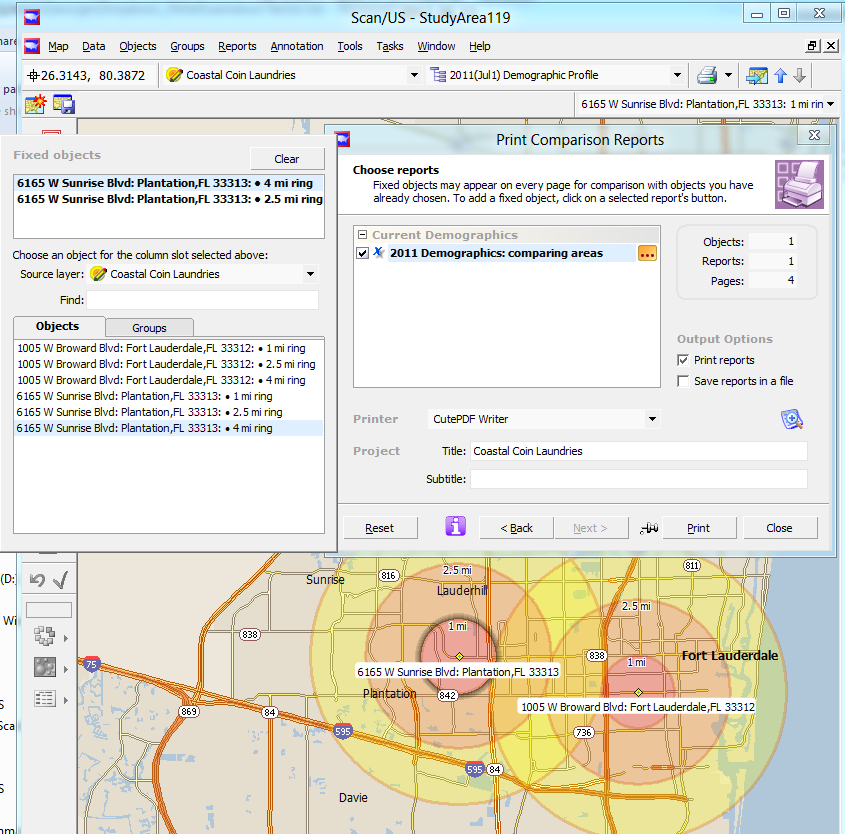
Repeat the choosing of the rings
Repeat the choosing of the rings, by clicking on "2nd column" and the object to fill it in, and "3rd column", and the object to fill it in. Your dialog should look like the figure above.
Before you click "Print", put a check next to "Save reports in a file" and UN-check Print reports. Also, you can enter a subtitle such as "Sunrise Blvd in Sunrise"
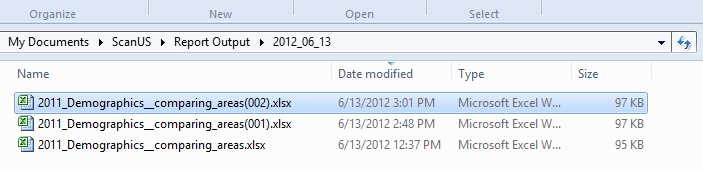
Select the most recent report
Finally, after you print, and click on the blue-underlined link to get the reports folder, above, open the report, look at it to make sure it is what you want, and choose "Print" from the Excel file menu.
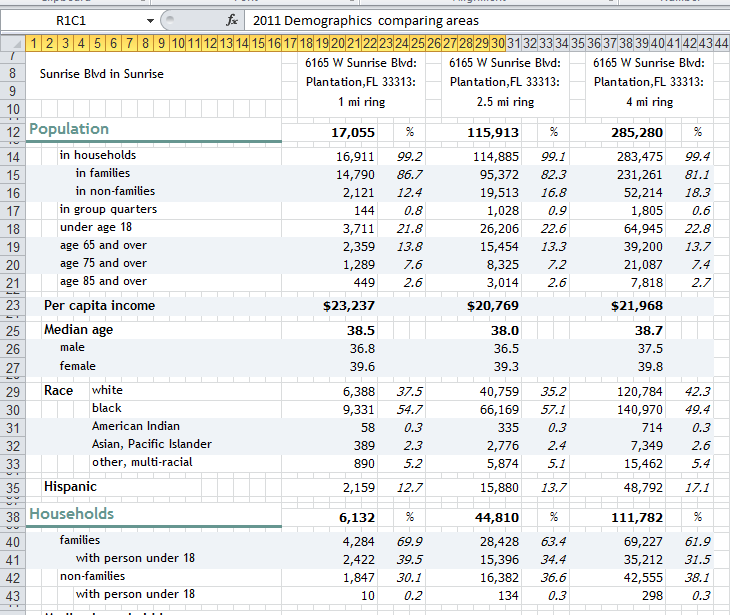
*Excel sheet for the second site *
You can also choose "Quicklook from the Scan/US data menu, to look at the rings.
This is just one use of the "Print Comparison Reports" tool. Another use, to compare the selected object against any other object in the system, is shown in the next section, "Comparison report."
Comparison report
Scan/US comparison reports facilitate the comparison of a series of objects, which can be specified in various ways, with one or two "fixed" objects, which appear on each page of the report. In other words, it is a three-column report, in which the first column varies, but the other two columns remain the same.
You can start with comparison reports by choosing "Comparison reports.." from the Scan/US Reports menu:
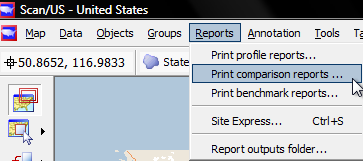
Comparison reports are reached from the "Reports" menu
To illustrate the capabilities of Scan/US comparison reports, we have done a small amount of preparation. Imagine that you work in marketing for the New York Philharmonic, and that you are having lunch with your friend who has the same job for the New Jersey Symphony Orchestra. You are principally familiar with the local New York audience, and don't know too much about the areas around the seven venues where the NJSO performs. Fortunately, however, you have Scan/US!
First, we have put down 5-mile ring around each of the 7 New Jersey locations. Data is automatically summarized for these rings. Second, we have made a group based on Census block groups located between 77th Street and 38th Street in Manhattan, a square roughly one mile in each direction from Carnegie Hall. Just over a quarter of a million people live in this area, which you know well.
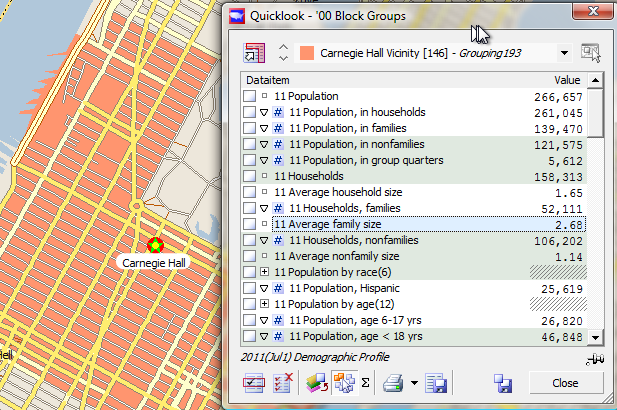
A geographic area centered on Carnegie Hall
With these two map enhancements in hand, we are ready to choose "Comparison reports.." from the Reports menu.
The first step is to choose the source object:
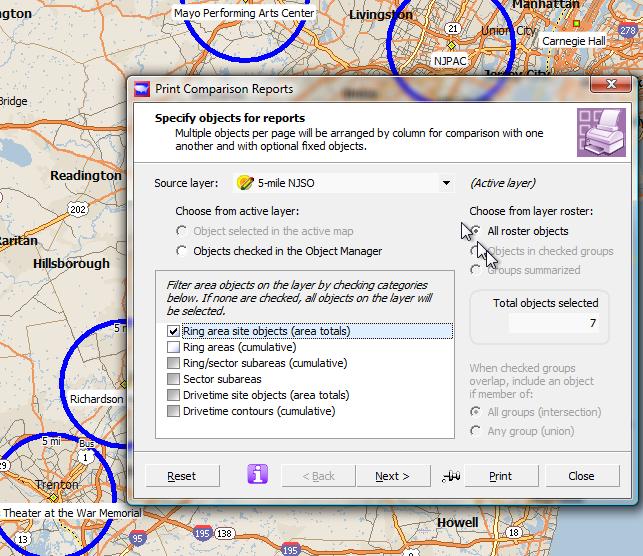
The source is the "compare objects" series, which changes from page to page
Your source layer will be the "5-mile NJSO" layer. Unlike Site Express, "Print Comparison reports" does not create your compare objects for you. You must have them already in hand.
Since we want comparisons for all seven locations, we choose the "All roster objects" option, (above right) and check "Ring Area site objects" (above middle left). Notice that "Total objects selected" is 7 objects. This is the correct number, so we click "Next", to proceed to the next step and select our report.
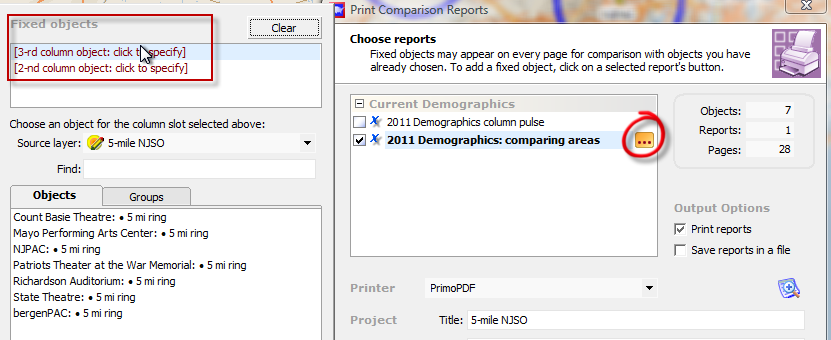
Press the dot-dot-dot button which appears next to the report
The only tricky part about this report is selecting the "fixed objects" for the report, which can only be done by pressing the "dot-dot-dot" button next to the report. This button only appears, however, when the report is selected. That is a Good Thing, because it means you will never select the button for the wrong report, waste a lot of time.
When you click the button, the "fixed objects" panel shoots out to the left. The third-column (right-most) and second-column (middle) objects are selected by first: clicking in the proper field shown in the red rectangle (above left), choosing the source layer for the fixed object in the middle, and then choosing the object or group you want from the tabs at the bottom of the Fixed objects dialog extension.
If you make a mistake, or more to the point if you come back in and wish to do a different comparison report, you can press the "Clear" button to start over.
We will choose two fixed objects to compare: the State of New Jersey, and our previously defined area around Carnegie Hall.
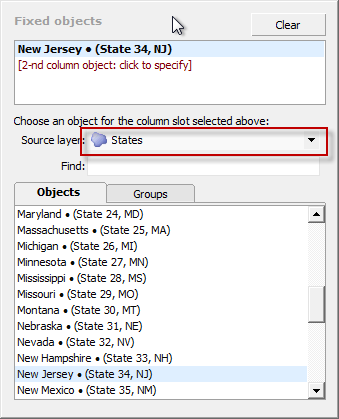
First, choose the fixed Column-three object
Choose New Jersey as the third-column fixed object by doing the following:
- Click in the "3rd-column: click to specify" area.
- Choose "States" from the "Source layer" dropdown.
- Scroll the "Objects" list down to New Jersey and click on it.
Your panel will appear as above.
Next, select the Carnegie Hall vicinity:
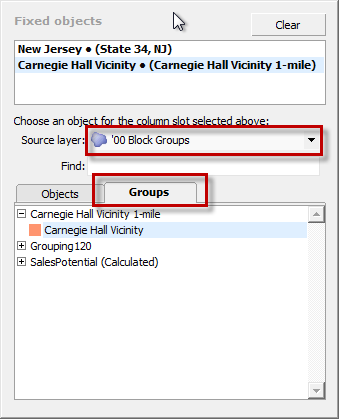
You can choose a fixed grouping on yet another layer
Choose the Carnegie Hall Vicinity area as the second-column fixed object by doing the following:
- Click in the "2rd-column: click to specify" area.
- Choose "'00 Block Groups" from the "Source layer" dropdown (first red rectangle, above). This is because you made your grouping on Block Groups.
- Click on the "Groups" tab (second red rectangle, above), and expand the grouping which contains the Carnegie Hall vicinity group, and select it.
Your panel will appear as above.
Finally, edit the title and subtitle, select the printer, and check the various output parameters.
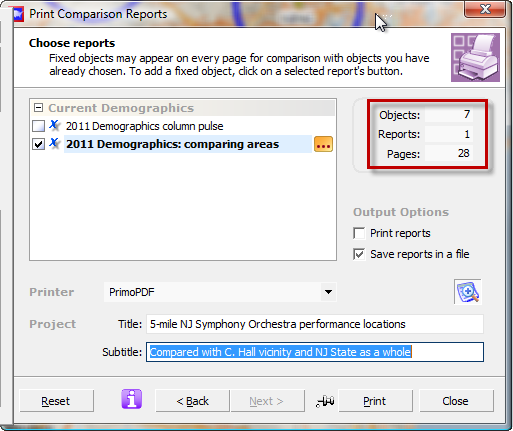
Last step: edit the title and subtitle
Before you click "Print", check the boxes which determine whether you will save to file, or Print, or both. Select your printer. Double-check the number of objects, reports, and pages you will generate. This is a four-page report, so with 7 objects it will end up being 28 pages.
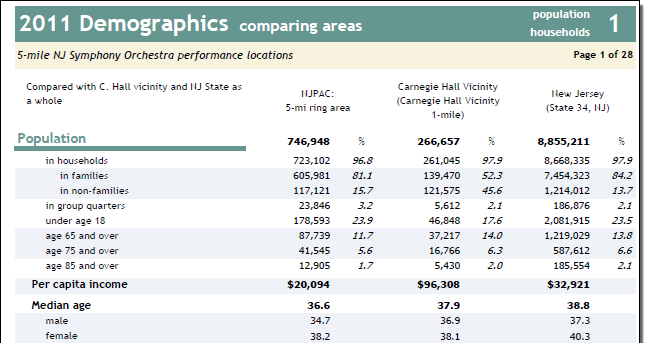
Sample page (first of 28)
This is the first page of the 7-areas comparison, and if you can finish reading it before you have lunch with your friend, you will be surprisingly well-informed.
If you do not fill out the "fixed" portions of the report, then Scan/US will fill in all three columns of the four-page report with five-mile rings from the original source, going three areas at a time, until all seven are taken care of. The report will be 12 pages, in that case. The readout will say that it is 28, because it is assuming you have used two fixed objects.