
Scan/US Groups: Powerful Filtering, Selection, and Summaries
Creating territories is simple with Scan/US groups. Territories can be based on demographic data, or data you import. You can make them interactively too, by clicking on the map.
You can create groups to use as a geographic filter for data export. Another way to think of this is as a geographic data query, or a query on a geographic area.
When you want to look at competitor locations, you can use groups to give the locations for each competitor chain a different look in the map, and keep all the competitor locations together in one file. This simplifes map management.
What is a group?
Groups are Scan/US’s method for “multiple selection”. Selecting more than one geographic object at a time (such as ZIP codes) is one way of creating territories.
A group (which is always named and saved) is an assignment of one or more objects to a group.
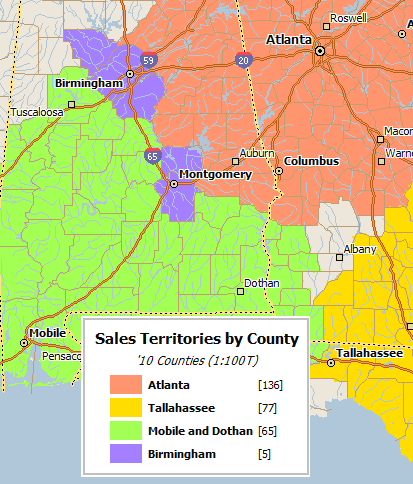
This map shows territories formed by four groups of counties. The numbers in the map legend show the total counties in each group.
Working with groups
Groups can be formed in two ways: manual or automatic.
Manual grouping can be done by radius, rectangle, drawing-around (polygon), or by clicking on the object in the map.
The great thing about manual grouping is that the group summary calculation is dynamic, and therefore instant. You can see what happens when you add a ZIP code to a group, or take it away. This is great for ZIP-code based franchise territory creation.
A lot of Scan/US customers use groups to put together a geographic area that must have a certain number of households (or some other demographic characteristic). They look at the Scan/US Quicklook data viewer to see the running totals for the group as they build their territory, and it works great. It is an interactive geographic query: the results are immediate.
Another use of groups is to make a map showing territories that are based on geographic objects (such as ZIPs), without the need to draw polygons.
Automatic territory creation
This can be done with automatic grouping if you have an Excel file showing what territory each ZIP is assigned to. The Scan/US function “classify by value” lets you assign each object to a group and color in your map territory based on an Excel column.
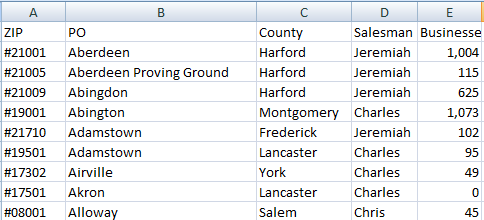
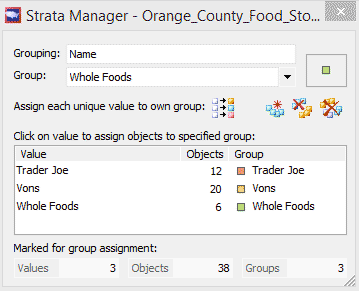
If you have a spreadsheet with a text value in a column, Scan/US can classify it so that groups are created based on that value. You can change the group names if you wish, but this map shows the names in the worksheet:
Create a group of locations based on a worksheet
Another use of this tactic (automatic group creation using “Classify by value”) is to simplify competitor location analysis by keeping all competitor locations in one file, and color-coding their map display by creating a group.
If you have a spreadsheet with store name and geographic coordinates (the sheet can contain other values as well):
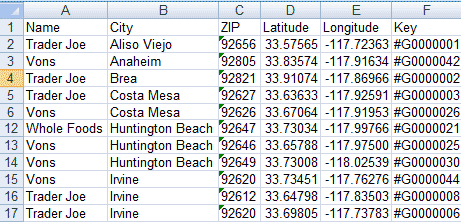
Then you can run it through “Classify by Value” (a simple choice from the Scan/US data menu):
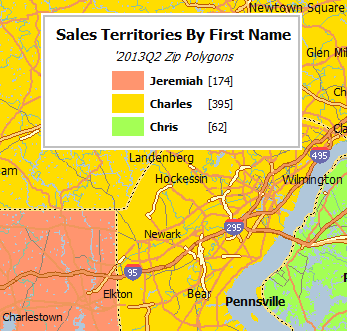
You will be able to produce a map from the single input file that looks like this:
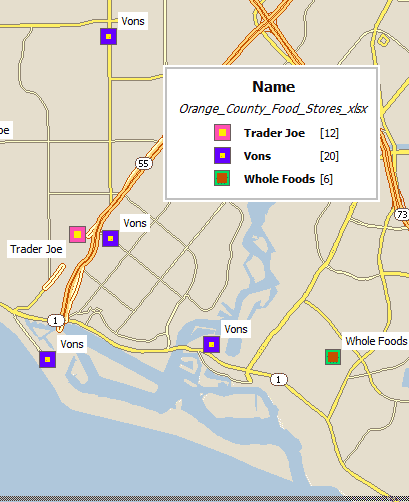
Notice that we have customized the group markers in the map a little more. If you have small iconic pictures or graphics files with the store logo on it, you can use those in the map.
Stratification of map objects based on income (or other demographic variable)
Another use of of the automatic form of “classify by value” is to stratify objects based on cut-points on a range variable of your choosing. Any of the 1000 built-in demographic variables can be used for this, or you can load an Excel file with your own data for ZIPs, Census Blockgroups, States, Counties, or other geographic layer, and use that for stratification. (Other formats are supported, but most people use Excel)
Once your map objects have been assigned to groups, nearly every Scan/US function permits filtering to use only “objects in selected groups”. The next illustration shows export of data from 28 ZIP codes with high median income near Madison Wisconsin.
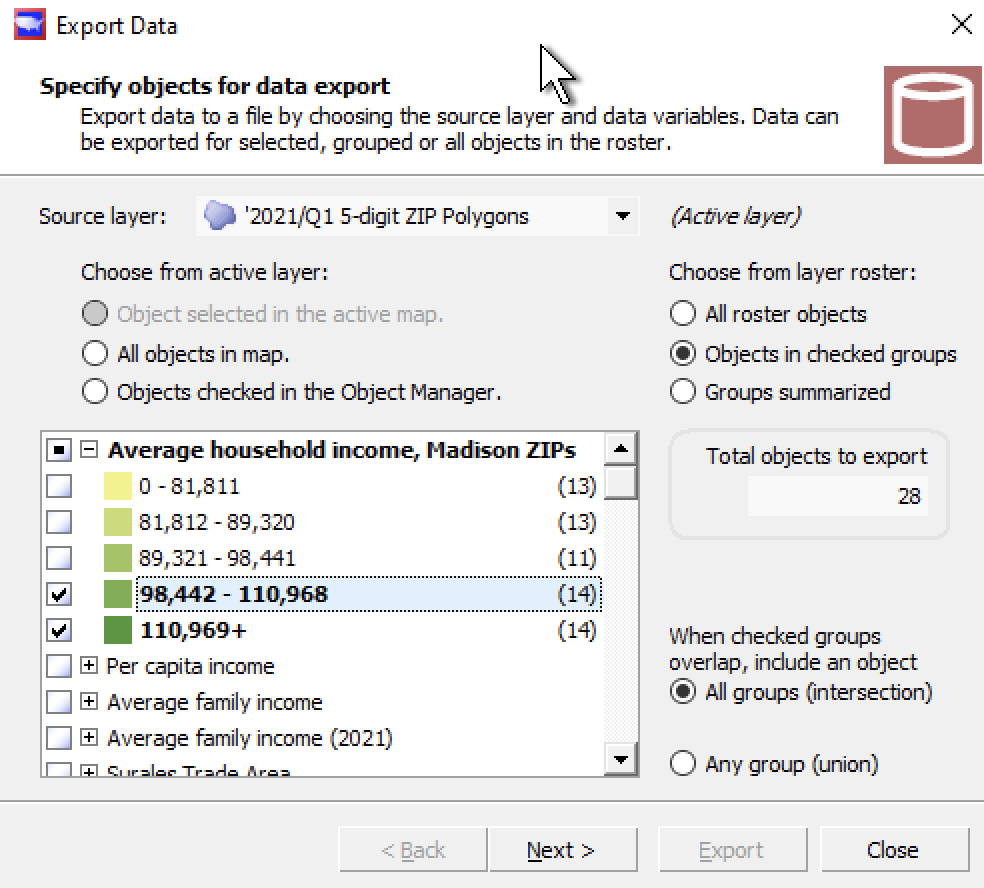
To be clear: this illustration shows the first step of data export: selection of a set of objects. In the second step, any number of demographic variables may be selected for data export.
Ways to use group filtering
There are many ways you can use groups to filter map objects
You can show, hide, suppress labels for these objects in your map.
You can summarize data, by group, for these objects
You can export data for grouped objects. This is useful if you want to export the demographic data for the ZIP codes that have the highest sales within five miles of your stores. The process is simple: import an Excel sheet with sales for each ZIP, classify the ZIPS by value, and export demographic data in grouped objects only for the highest sales ZIPS.
Groups let you summarize, compare, filter, export data, and customise your maps. They are built in to every Scan/US Subscription.
© 1992-2021 - Scan/US, Inc.